
{[userprofile.firstName]} {[userprofile.lastName]}
{[userprofile.totalFollowing]} Followers
{[userprofile.totalFollowed]}
{[userprofile.bio]}
{[userprofile.gender]}
{[userprofile.town]}
{[userprofile.state]}
{[userprofile.realNumber]}
{[userprofile.website]}

-

Rofiat Ajoke
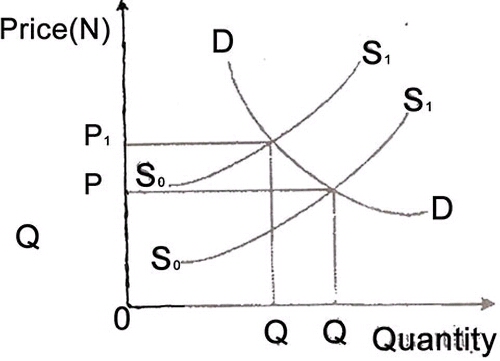
Equilibrium exist where supply and demand curves cross. it is a situation whereby supply nd demand are equal at the prevailing price. Equilibrium price : Formula; equilibrum price equals supply equals demand.
0 16-02-2016 12:37:00 +0000
-
Rofiat Ajoke
The diagram shows dat equilibrium price will increase while equilibrium quantity will decrease.
0 16-02-2016 12:40:00 +0000
-

Inyang Umoh (tutor)
Good day. I'm the Jambite economics tutor. There are a few small problems with the graph. For example the various quantities should have been given different names to avoid confusion (for example Q0 and Q1 and P0 and P1). Here is my explanation of the graph. The graph is showing two different equilibrium points. 1) if the price is P then the graph is showing what quantity demanded and supplied 2) if the price is P1 the graph is showing what the quantity demanded and supplied would be
0 21-02-2016 23:27:00 +0000
-
Inyang Umoh (tutor)
Please review my post on Equilibrium in this Economics forum
0 21-02-2016 23:29:00 +0000
-
Kingsley Nsan
guys the diagram is wrong.. the lines are not well labeled... i saw it in 1 of the questions... n i. began 2wonder where the change occurred
0 23-02-2016 14:32:00 +0000
-
{[reply.name]}
{[reply.voteCount]} {[reply.voteCount]} {[reply.created]}
{[reply.voteCount]} {[reply.created]}